How often does the LTE link drop?
Drop frequency and duration per airframe, per site and per firmware version — so link problems become a pattern rather than an anecdote.




Flight logs are rich and slow. The data to explain a recurring fault is almost always already recorded — it is just spread across hundreds of flights nobody has time to open. Log insights turns that archive into answers.
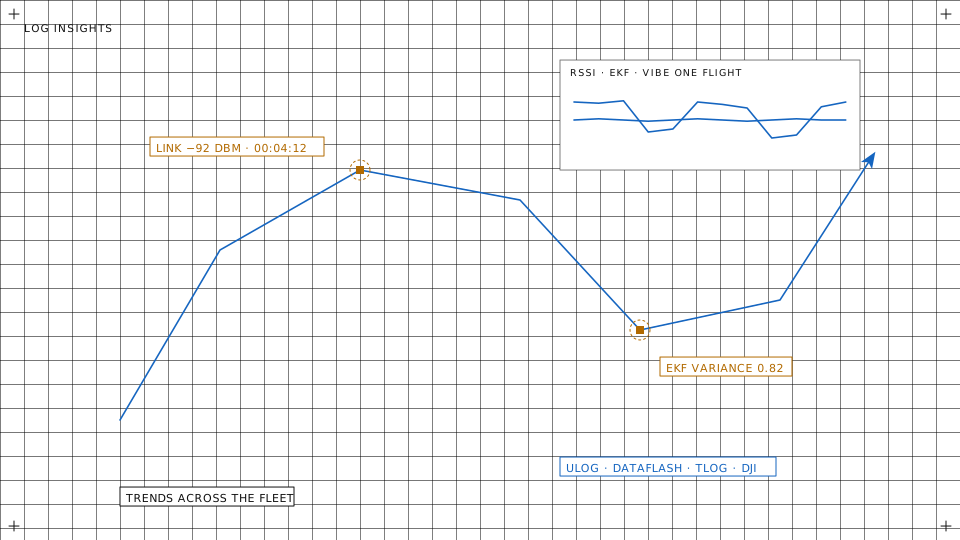
Each of these is one query across the whole flight history, not a manual afternoon.
Drop frequency and duration per airframe, per site and per firmware version — so link problems become a pattern rather than an anecdote.
Correlate EKF bad-AHRS reports against compass and IMU health to separate the symptom from the sensor actually causing it.
Rank compasses and IMUs across the fleet by measured noise, so component selection is evidence rather than preference.
Flight logs · trends across the fleet: flight time, distance, speed, altitude per flight with the mean of the last seven
Visual or lidar odometry can be added to the navigation stack without rebuilding the aircraft around it.
The log analysis that found the problem is what verifies the fix — no separate evaluation harness to build and maintain.
Designed around how development teams actually iterate: instrument heavily, fly often, compare campaigns.
Today every flight log is plotted in the browser, flight statistics trend across the fleet and per device, and the health digital twin reduces each log to component KPIs judged against the device's own history.
The questions on this page — link drop rates, compass against IMU, the noisiest IMU in a batch — are what that pipeline is being built to answer. Ask us which of them run on your logs today.
Bring a flight log and a question about your fleet — we will show you what the analysis returns.