



· Yogesh Khedar· Operations· 3 min read
Utility Inspections with Drones and Robots — How and Why
Power lines, substations, pipelines, wind and solar — why drones changed inspection economics, and why ground robots belong in the same programme.
Utility assets, power lines, substations, pipelines, wind turbines, solar farms, bridges, share a property: they are numerous, distributed, and expensive to inspect by hand. This is the work where drones first earned their keep, and where robots are earning theirs now.
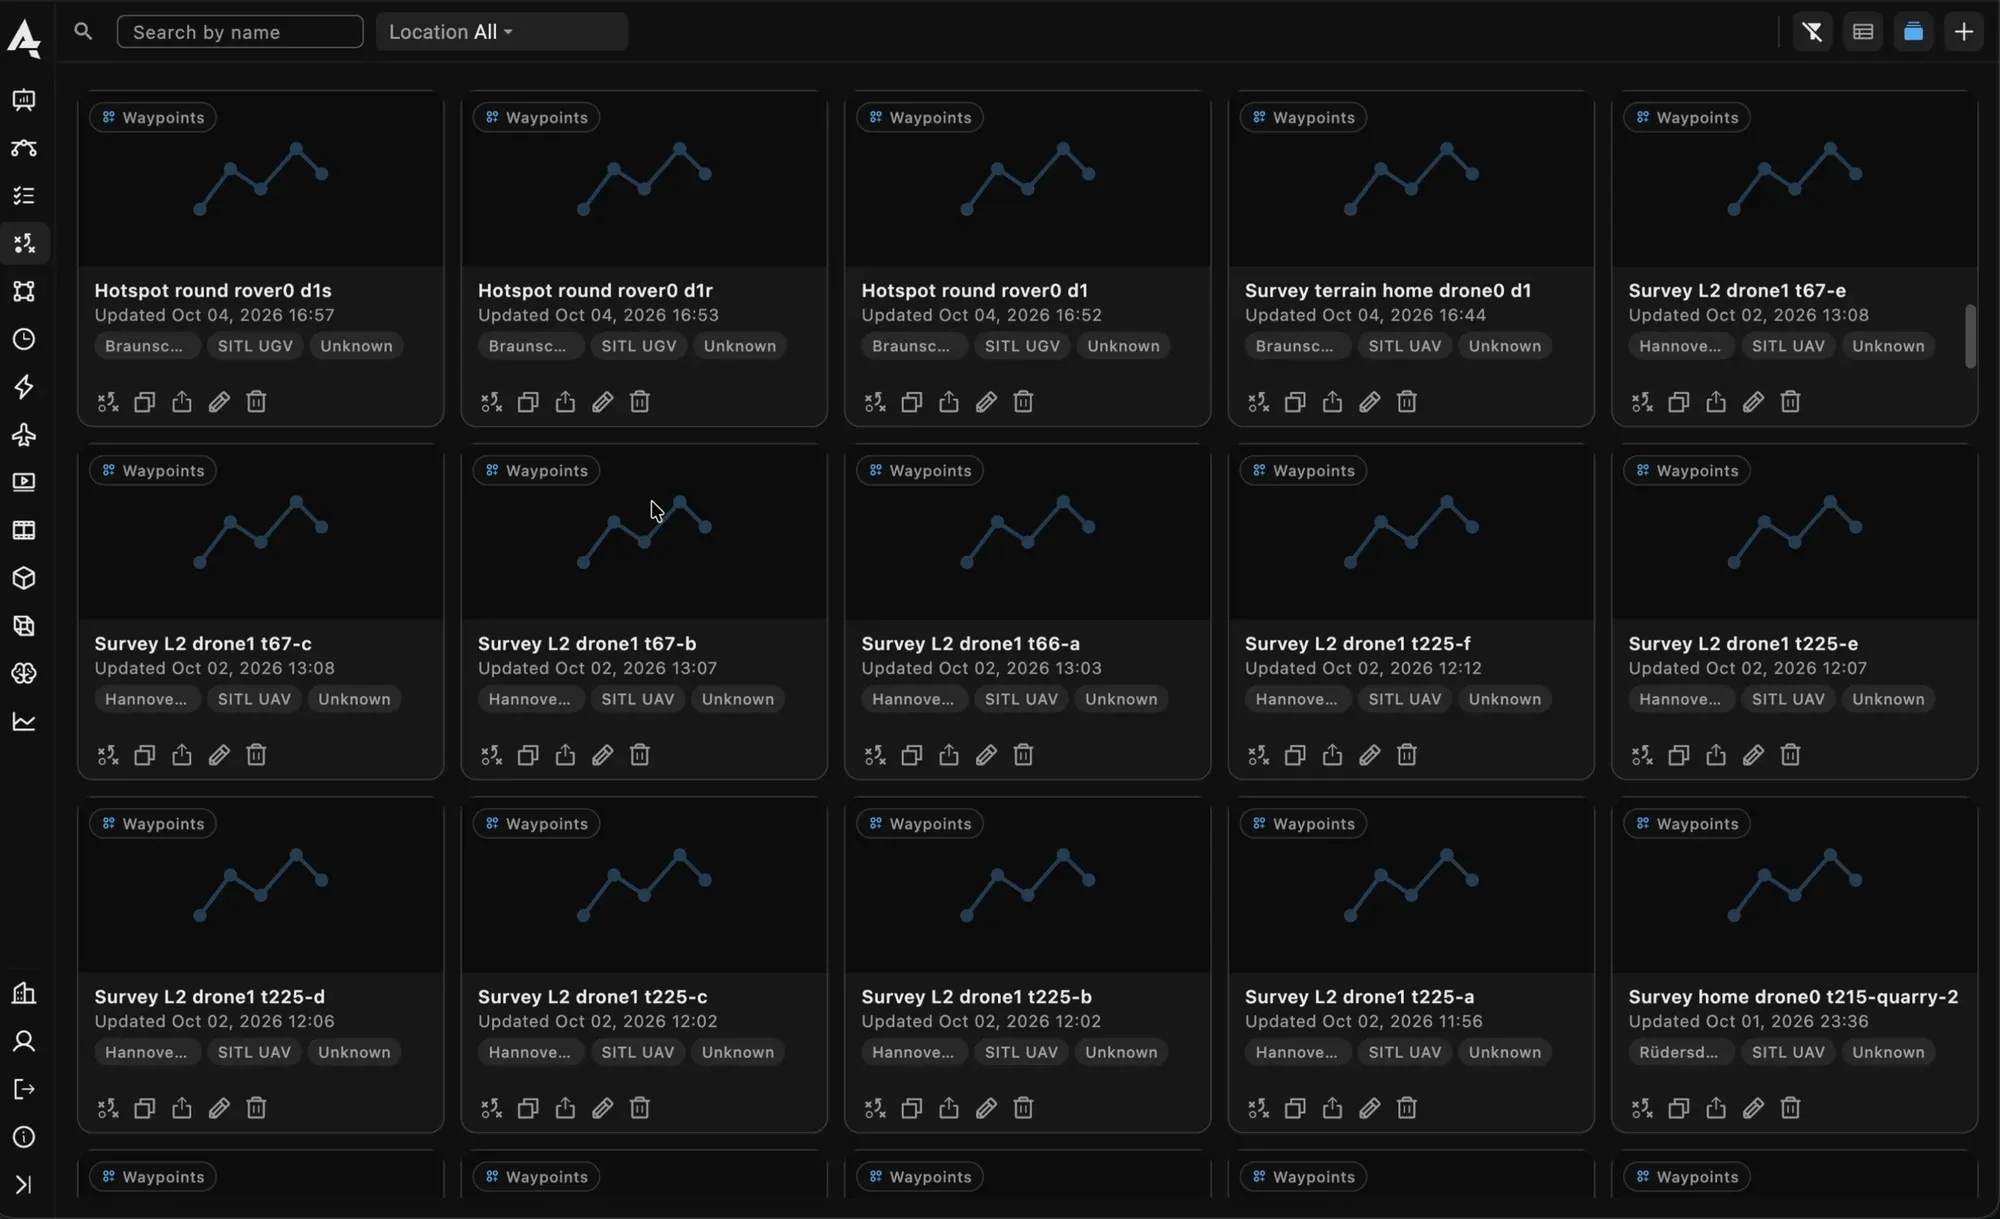
The plan library as cards: corridors, surveys and waypoint routes, each with its site and aircraft.
Why drones changed the economics
Speed and safety. A drone survey replaces rope access, scaffolding and lane closures with a flight. Nobody hangs off the asset, and the asset keeps operating.
Just as important is repeatability. The same corridor plan flown every quarter, the same orbit around the same tower, the same facade pass, produces directly comparable data. That is what turns inspection from a snapshot into trend monitoring: not “is there a crack” but “is the crack longer than in March”.
The plan types that matter here are the ones the planner draws for you: a corridor of parallel passes along a line, an orbit with ring heights around a mast, a facade scan up and down a wall, a survey grid over a solar field with the thermal camera’s line spacing. Each plan is kept in the library with the asset it belongs to and flown again from a dock or by a pilot, unchanged.
Why robots too
Aircraft have limits. They cannot hold position under a bridge deck for minutes, work beneath dense vegetation, or get contact-close to a fault. They cannot stay out for six hours. Ground robots can, which is why serious inspection programmes are becoming multimodal: the drone finds it, the ground vehicle inspects it, one report covers both.
A rover under the line, a legged robot in the substation, a boat along the quay: on the same console, with the same plan editor and the same logs. The finding the aircraft marked is the point the rover drives to.
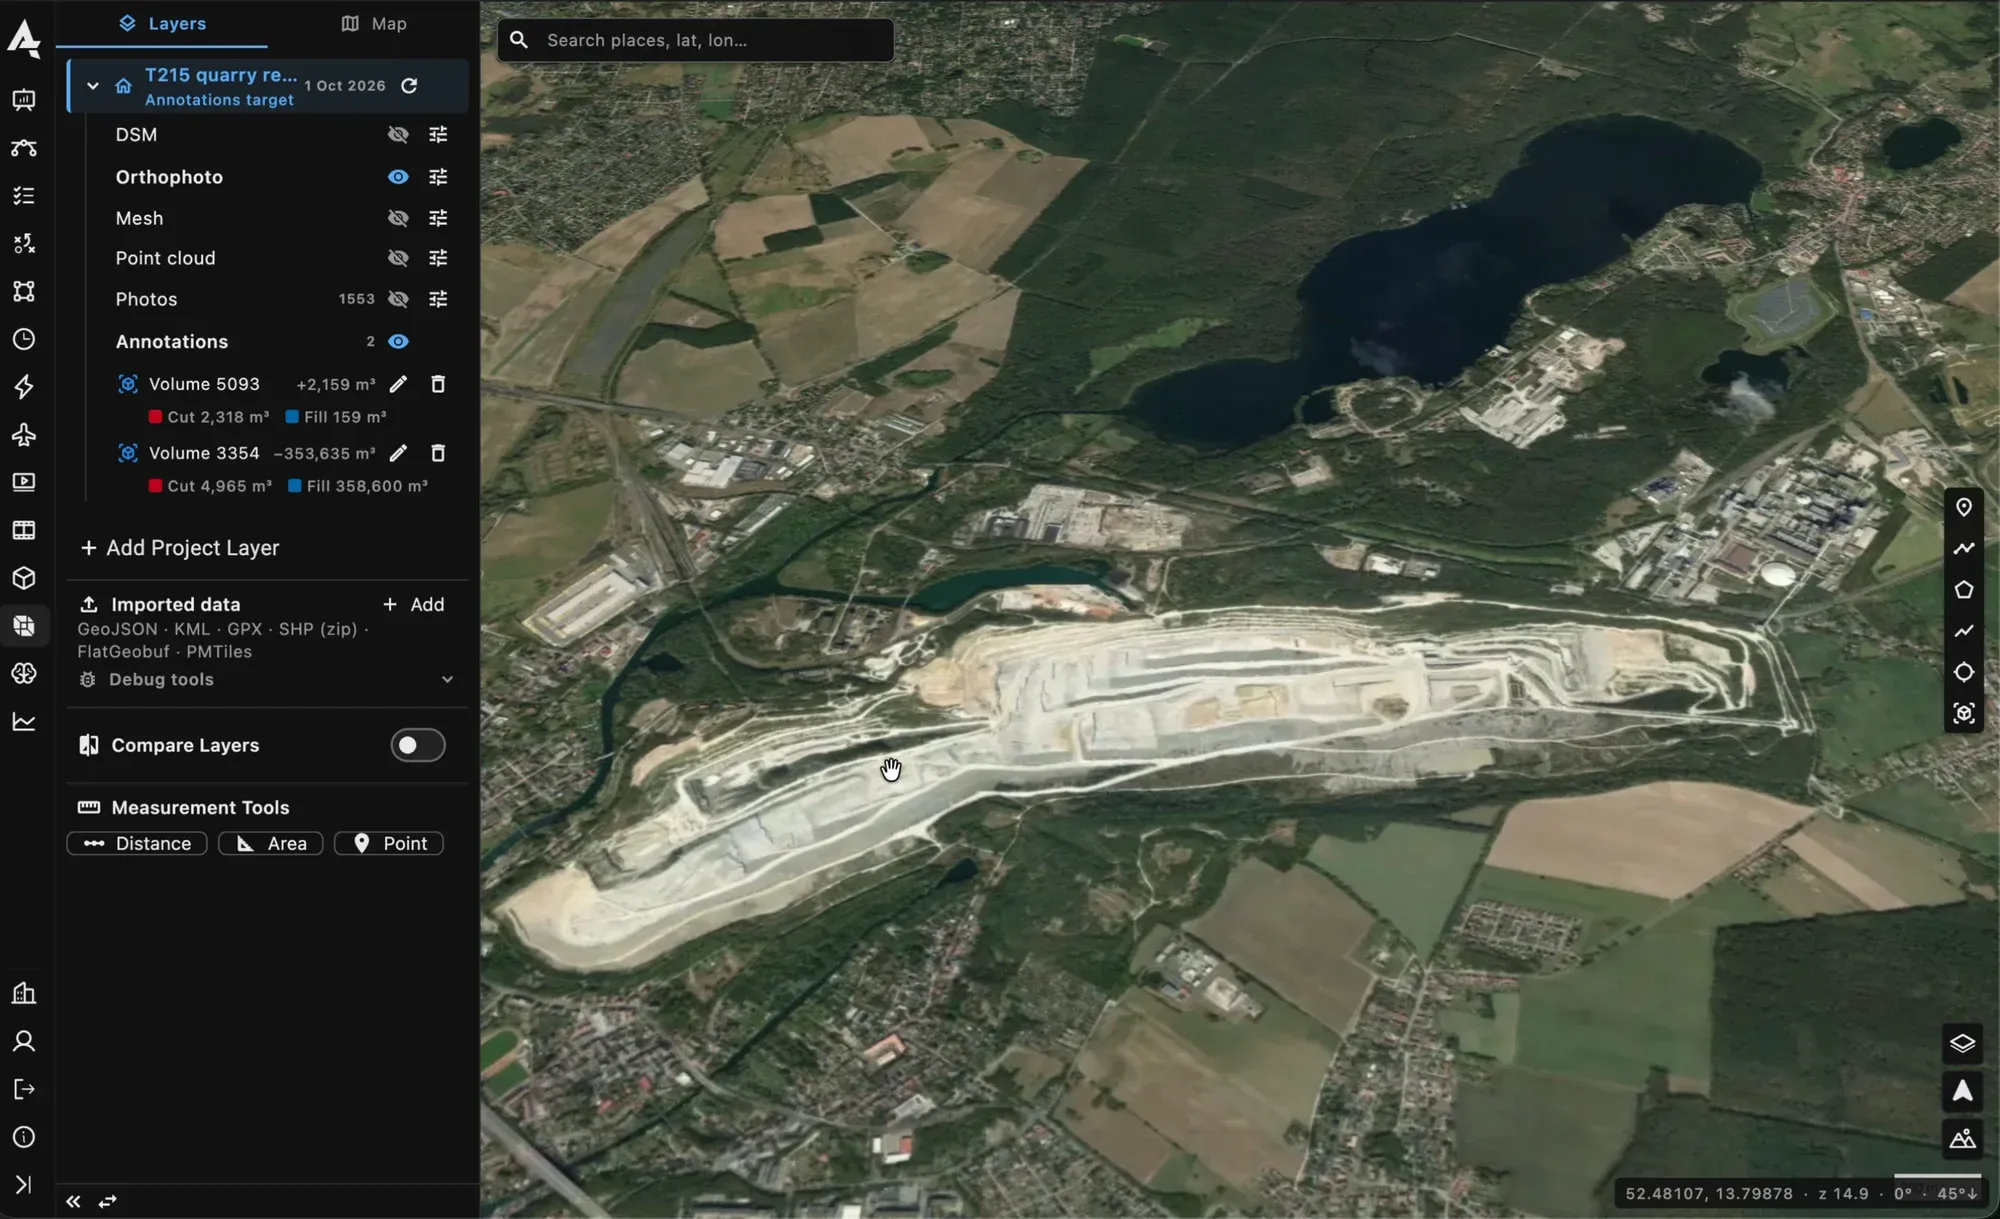
The project map with its layers and two volume annotations.
The data pipeline is the product
Capture is the easy half. The value appears afterwards, and the afterwards has to happen by itself.
- Upload. The photos leave the aircraft when it lands or docks, filed by flight, into the asset’s project. Nobody carries an SD card.
- Processing. An orthomosaic, an elevation model, a mesh for the structure, a thermal map with a temperature at any point, run on the server with the settings kept per run.
- Comparison. Two dates of the same plan, the photos paired by waypoint and swiped, the orthomosaics side by side, the change between them computed on the map.
- Findings. Detections from a model on the live stream or on the images, located on the map, each one a record with a place, a time and a photo.
- The report. Generated from structured data, not assembled from a folder of photos, with the flight log and the compliance record attached.
That is the mapping and data sync side of AutrikOS, and the reason the plan library and the project sit in the same place.
What we learned flying it
In the AeroInspekt and BridgeInspect campaigns, three things decided the outcome more than the aircraft did: flight discipline, the choice of sensor for the defect class, and whether the data arrived in a project by itself or in a jacket pocket. The programmes that worked were the ones where the engineer opened the project the next morning and the map was already there.
Responsible for an asset base that outgrew manual inspection? Talk to us, and see the inspection page for the setup.